The heights of mountains and the altitude of aircraft
are often given as ‘above sea level’, as if the level of the sea
was permanently fixed. Yet even in the present day, it is very
difficult to pinpoint the level of the sea accurately. The sea moves
continuously, not only with the tides, but with wind, waves, and
currents, and even daily changes in temperature and chemistry. In
the UK, heights are measured relative to the Ordnance Datum, an
average achieved by year upon year of measurements of the mean
sea level shown by tide gauges at particular sites.
Elsewhere, the markers are different. Satellite measurements
from the Topex/Poseidon mission in the 1990s and more recently
by the Ocean Surface Topography Mission on the Jason-2
satellite can measure the height of the sea surface globally with
extraordinary accuracy. But this, if anything, only serves to
complicate the picture, revealing, for instance, that the sea surface
is actually higher above undersea mountains and lower above
submarine canyons because of gravitational differences.
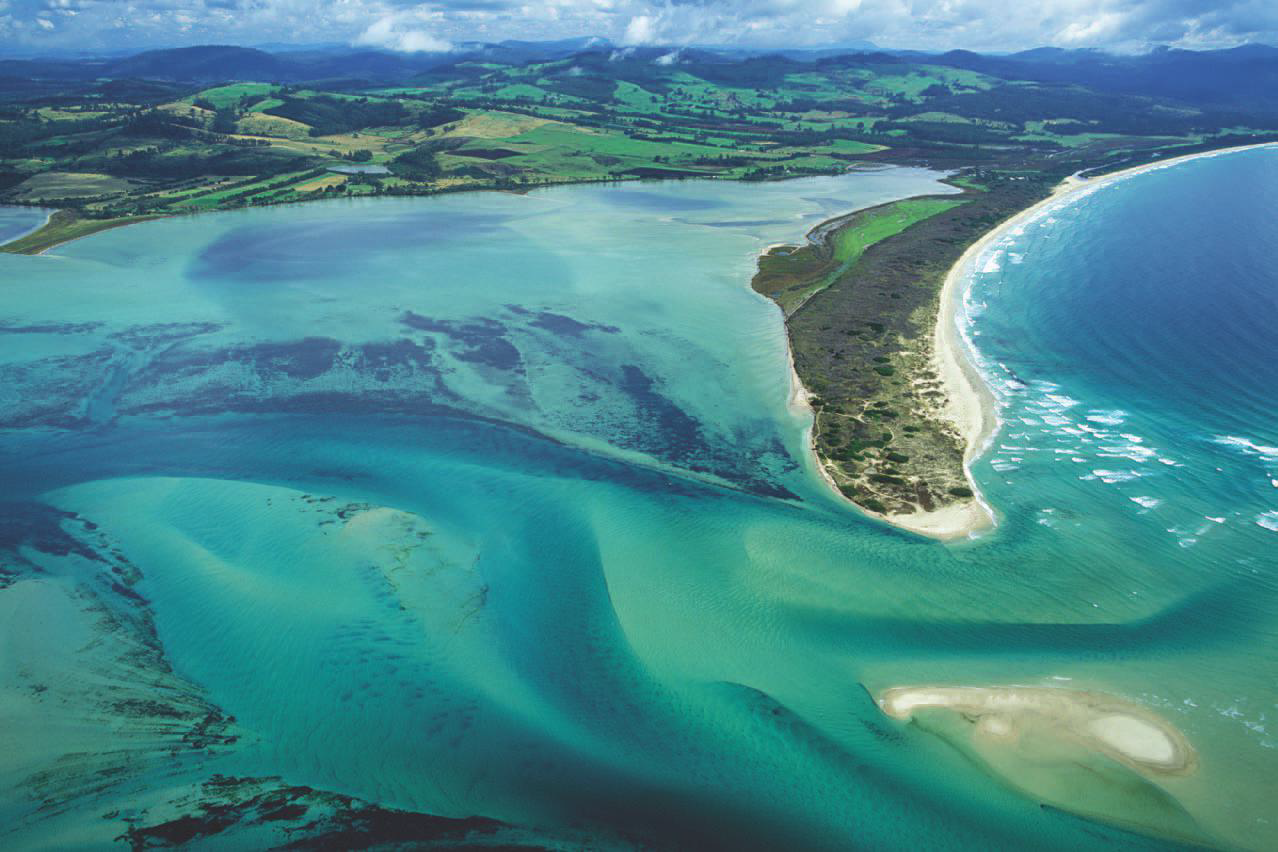
Seabed sediments
In fact, the level of the sea has varied enormously throughout
geological history. The widespread occurrence of sedimentary
rocks formed from seabed sediments, for instance, is testament
to the fact that huge areas that are now dry land were once
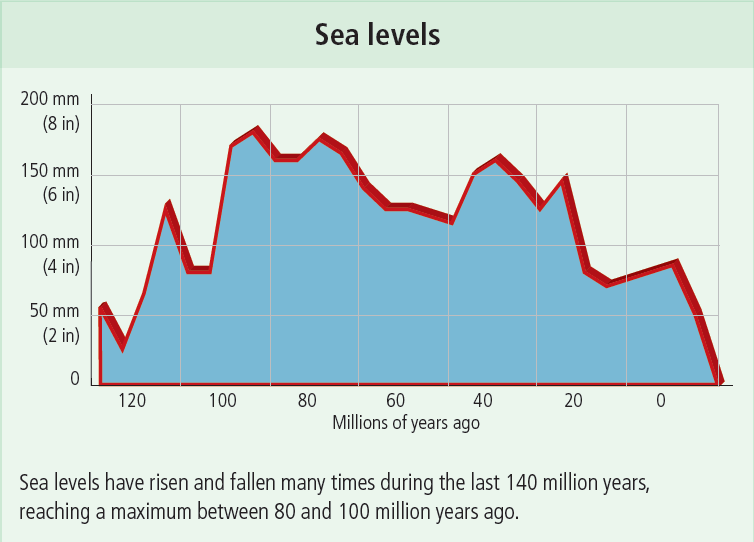
underwater. The famous white chalk rocks of southern England,
the US state of Kansas, and many other places were formed when
the seas rose so much in the warm Cretaceous period 80 million
years ago that only a few higher parts of what is now Europe and
North America were left above the waves as islands. The oceans
then were fully 200 m (656 ft) above their level today, and the
thickness of the chalk rocks, formed largely from the remains of
tiny sea creatures, shows just how deep the sea was then.
Plotting the changes in sea level over geological time is an
incredibly complicated business, because the relationship
between sea and land is continually altered, both locally and
globally, by the constant movement of the tectonic plates,
the break-up and convergence of landmasses, the continual
creation of new mountains, as well as the destruction of old
mountains, and a host of other factors.
Nevertheless, geologists have been able to plot changing global
sea levels over the last 550 million years. Half a billion years ago, at
the end of the Cambrian, the sea was up to 400 m (1,300 ft) above
its current level. Then, about 300 million years ago, it dropped for
a while below its current level, before gradually rising throughout
the age of the dinosaurs to reach the Cretaceous maximum
about 80 million years ago before starting to fall again. The
sea is now pretty much at its lowest ebb in geological history,
which is why in the long-term future, it can only really go up.
Rising and falling
Typically, sea levels were higher in periods when the ocean floor
was much younger and made of many smaller, less dense plates.
When this was so, the ocean floor rode higher on the mantle and
sea levels rose. When the floor was older and plates were larger
and denser, the ocean floor sank and so did the sea level. Typically,
too, sea levels fluctuated more when the continents were near
the poles rather than the equator, because then, huge amounts
of water could be locked up on land in polar ice caps.
The ice age changes
On the whole, changes in global sea levels depend on two factors
– the height at which the continents float on the mantle (isostatic
change), and the amount of water in the oceans (eustatic change).
At the beginning of the last ice age, the formation of huge ice
sheets locked up huge amounts of water on land and the oceans
shrank and fell by up to 130 m (427 ft) below their present level
about 16,000 years ago, exposing the present-day continental
shelf. But the mass of ice on the land weighed down the land, like
an overladen ship, so that towards the end of the ice age, ocean
levels actually began to rise again. And with warmer temperatures
at the end of the ice age, sea levels rose higher still as the ice on
land melted and swelled the oceans.
All around the world, low-lying coastal plains and river valleys
were drowned, creating estuaries, rias, and fjords.
At the same time, however, the melting of the ice was like
jettisoning the ship’s load, and the depressed land began to slowly
rise again in places. In Scotland, ancient beaches raised tens of feet
above the current shoreline bear clear witness to the scale of this
‘isostatic rebound’. Interestingly, while the northwest of the UK,
which had born the greatest weight of ice, bobbed up higher, the
southeast was tilted lower – allowing the flooding of the English
Channel, which was once dry land, about 4,000 years ago.
By 2050, the average rise will be 4 to 8 inches along the Pacific, 10 to 14 inches along the Atlantic, and 14 to 18 inches along the Gulf.
Higher Temperatures.
Changing Rain and. Snow Patterns.
More Droughts.
Warmer Oceans.
Rising Sea Level.
Wilder Weather.
Increased Ocean Acidity.
Shrinking Sea Ice.
A new book examining the forces shaping the future of global migration forecasts Michigan as the best place in the world to live in 2050.
The capital of Indonesia is the fastest sinking city in the world—it’s sinking at the rate of 6.7 inches per year. By 2050, 95% of North Jakarta will be submerged, according to researchers. The region has already sunk 2.5 meters in 10 years and almost half the city is below sea level. According to Climate Central’s interactive costal risk screening tool, rising sea levels could render parts of North Wales and eastern England underwater in thirty years, along with swathes of railways, farmland and holiday resorts.
Where is safest from climate change?
The best places to live in the U.S. if you’re concerned about climate change include:
Anchorage, Alaska.
Honolulu.
Spokane, Washington.
Eugene, Oregon.
Santa Barbara, California.
Tucson, Arizona.
Albuquerque, New Mexico.
Portland, Maine.