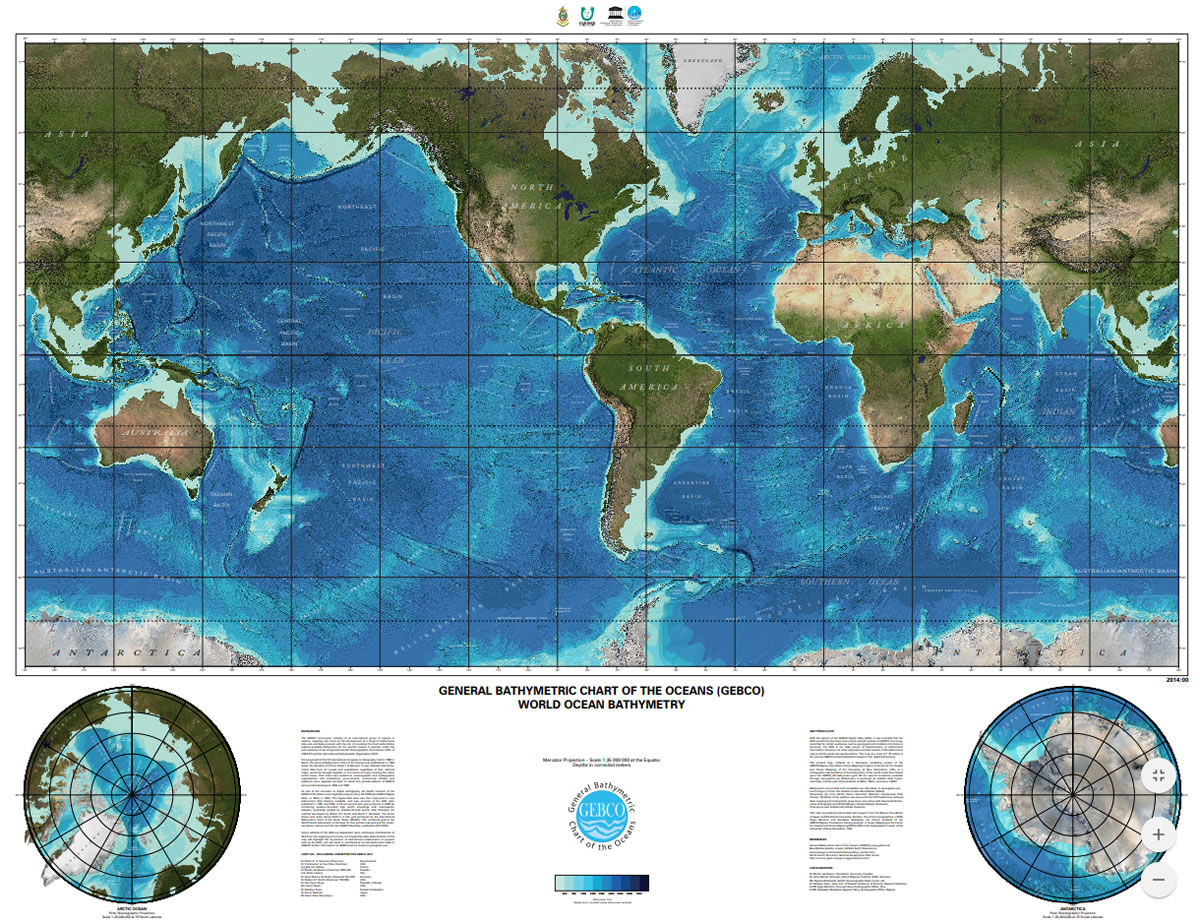
The GEBCO world map shows the bathymetry of the world’s ocean floor in the form of a shaded relief colour map.
- Adobe PDF format(60 Mbytes).
- GeoTIFF format(445 Mbytes) for the region between 72°N and 72°S.
Please notethat because of the size of the files we recommend that they are saved to disk rather than opened from the above links.
Data set acknowledgement
If imagery is reproduced from the GEBCO world map then we suggest the following form of acknowledgement
“Image reproduced from the GEBCO world map 2014, www.gebco.net”
Creation of the map
Work on the creation of the GEBCO world map began as a laboratory workshop project of the Nippon Foundation/GEBCO Training Project at the Center for Coastal and Ocean Mapping of the University of New Hampshire, USA.
The map is based upon bathymetry data from the GEBCO_08 Grid, version 20100927, a global bathymetric grid with 30 arc-second spacing. The grid is largely based upon a database of ship-track soundings with interpolation between soundings guided by satellite-derived gravity data. Where they improve on the existing grid, data sets developed by other methods have been included.
This release is an updated version of the 2013 world map (second release). It now includes the names of undersea features.
The land imagery is taken from the US National Aeronautics and Space Administration’s (NASA) Blue Marble data set. The coastline is taken from the World Vector Shoreline.
The first release of the GEBCO world map was published in 2007 and was based on bathymetry data from the GEBCO One Minute Grid.
Use of the GEBCO world map
The image file has been made available for you to download and either print or use in digital form.
The map is supplied under the following terms and conditions
- Use of the printed map and/or digital imagery for scientific research, environmental conservation, education or other non-commercial purposes is authorised without the prior permission of the data set originators, providing the source material is properly credited.
- Use of the printed map and/or digital imagery for sale or for use in a commercial product or for any other commercial purpose is prohibited without the prior permission of the data set originators. In the first instance, any request for such permission should be addressed to the British Oceanographic Data Centre (email BODC Enquiries).
Answer: Generally, we use maps asa reference to show political boundaries, landforms, water bodies, and the positions of cities. Maps also help us to know the routes of an area, landmarks, location (latitudes and longitudes) of a building or things, etc.
How many countries are in world map?
This total comprises193 countriesthat are member states of the United Nations and 2 countries that are non-member observer states: the Holy See and the State of Palestine. Summary. By this methodology, there are therefore 253 “countries” in the world: 193 independent nation-states, 55 dependencies, Antarctica, and 3 other areas.
How is world map divided?
Specifically, this world map divides the population into these 4 regions:North, South & Central America/North, West & Central Africa = 1.9 Billion People.Europe/East Africa/MiddleEast/Northern & Central Asia = 1.9 Billion People. … Oceania/China/Part of Southeast Asia = 1.9 Billion People.
Which the largest country in the world? Russia
What is the smallest country in world? Vatican City
The smallest country in the world is Vatican City, with a landmass of just 0.49 square kilometers (0.19 square miles). Vatican City is an independent state surrounded by Rome.
Is world map wrong?
Though designed with the best of intentions — to provide a detailed and coherent projection of Earth — flat maps are far from accurate; some areas look far bigger than they really are, others appear much smaller, and distances between various land masses are misrepresented.
Who Mapped the world?
the man who wrote the codes for the maps we use today wasGerard Mercator, a cobbler’s son, born 500 years ago on a muddy floodplain in northern Europe. In his own time, Mercator was “the prince of modern geographers”, his depictions of the planet and its regions unsurpassed in accuracy, clarity and consistency.
How old is the world map?
The first known world map is etched on a2,500 year oldBabylonian cuneiform clay tablet.
Who divided countries?
Europeans in the 16th century divided the world into four continents: Africa, America, Asia and Europe. Each of the four continents was seen to represent its quadrant of the world—Europe in the north, Asia in the east, Africa in the south, and America in the west.
What is the world map called? the Mercator projection
The world map you are probably familiar with is called the Mercator projection (below), which was developed all the way back in 1569 and greatly distorts the relative areas of land masses. It makes Africa look tiny, and Greenland and Russia appear huge.
Which country is the richest? Luxembourg
Known for high-income levels and a low unemployment rate,Luxembourgis the richest country in the world.
How do you explain maps to students?
Tips to Help Students Build Mapping Skills
- Get Rid of the Compass. Compasses and GPS are extremely helpful and everyone should learn to use them. …
- Start with Small Maps. Whatever is taught, it’s always best to start small. …
- Teach them the Symbols. …
- Get Them Outside.
Who draw the first map of the world? Anaximander
Anaximanderwas the first ancient Greek to draw a map of the known world. It is for this reason that he is considered by many to be the first mapmaker.
What is the oldest map in existence? the Babylonian Map of the World
More commonly known as the Babylonian Map of the World,the Imago Mundiis considered the oldest surviving world map. It is currently on display at the British Museum in London. It dates back to between 700 and 500 BC and was found in a town called Sippar in Iraq.