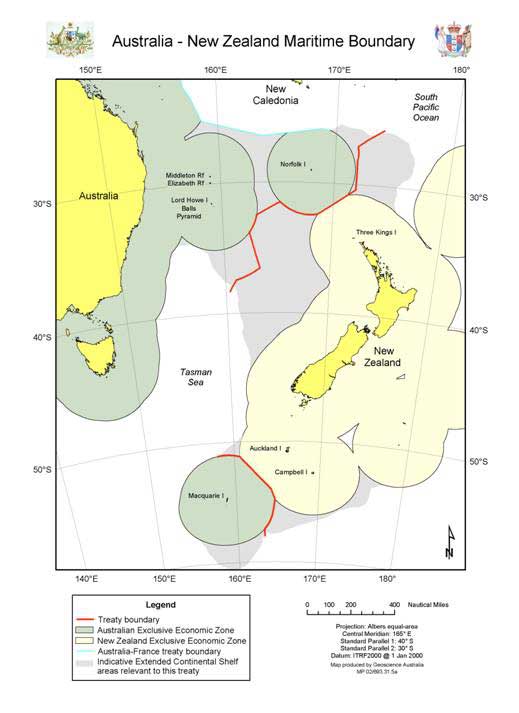
New Zealand maritime claims about baselines from which the breadth of the territorial sea and maritime boundary delimited between New Zealand and Australia
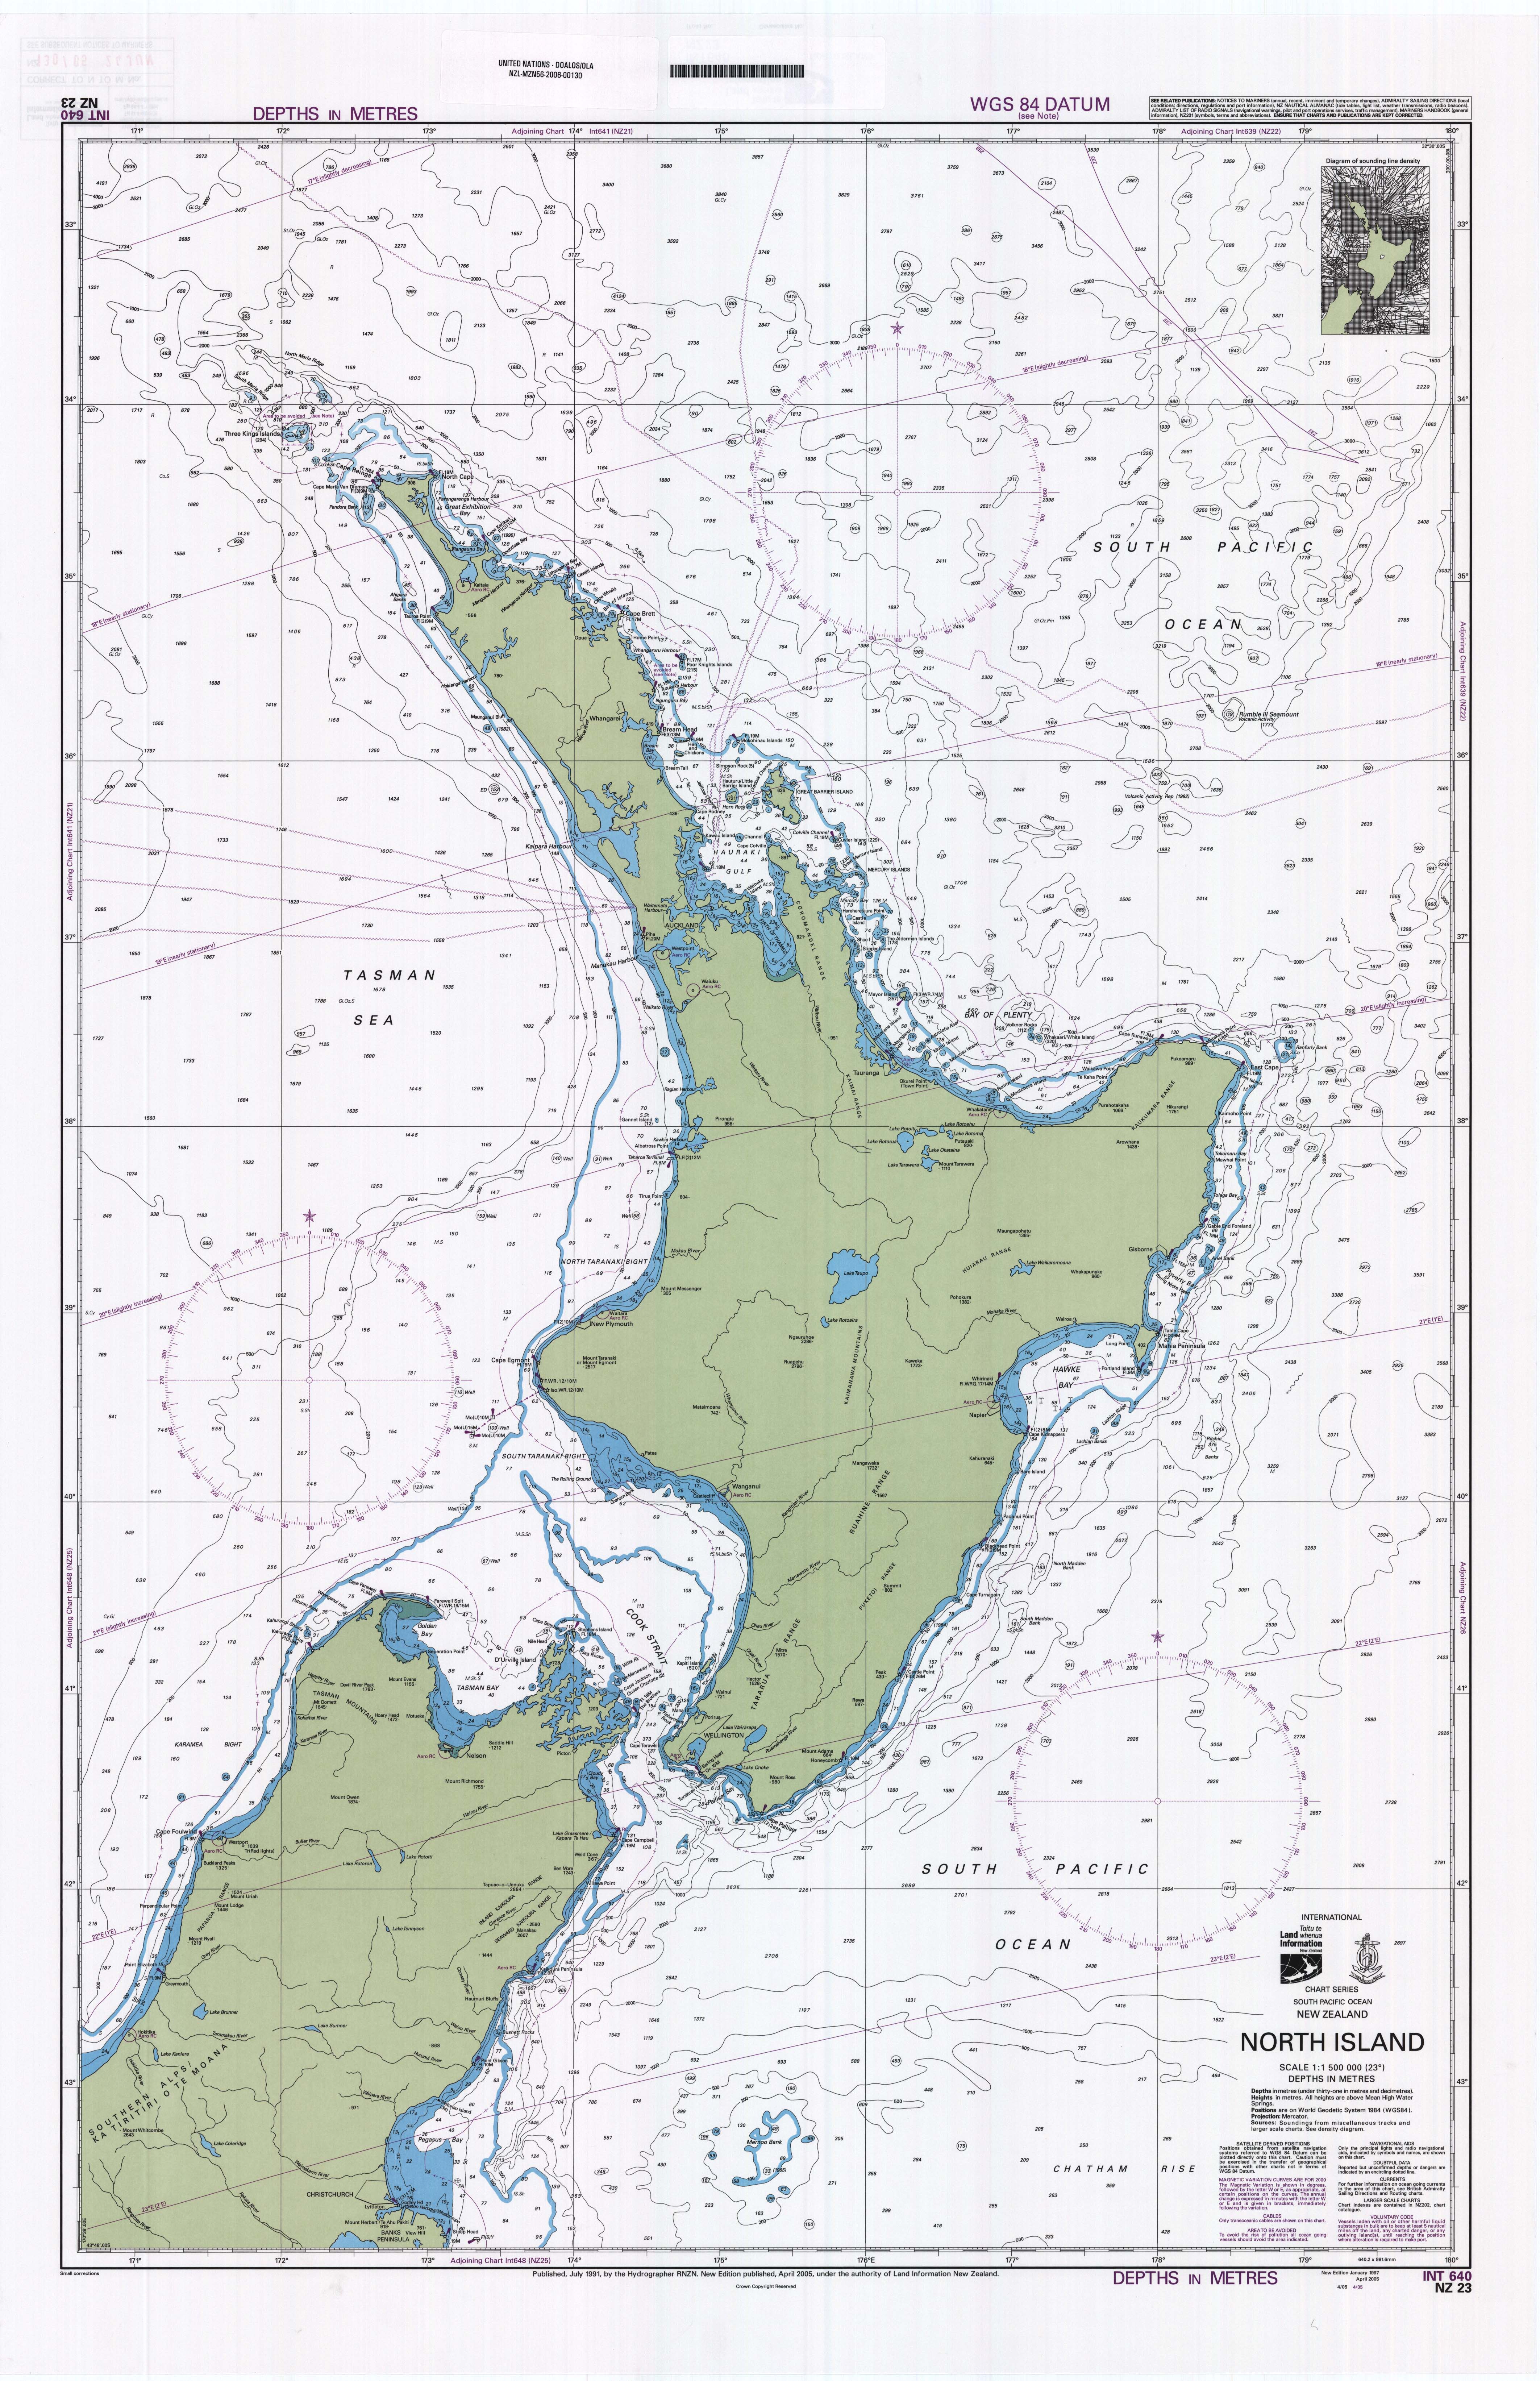
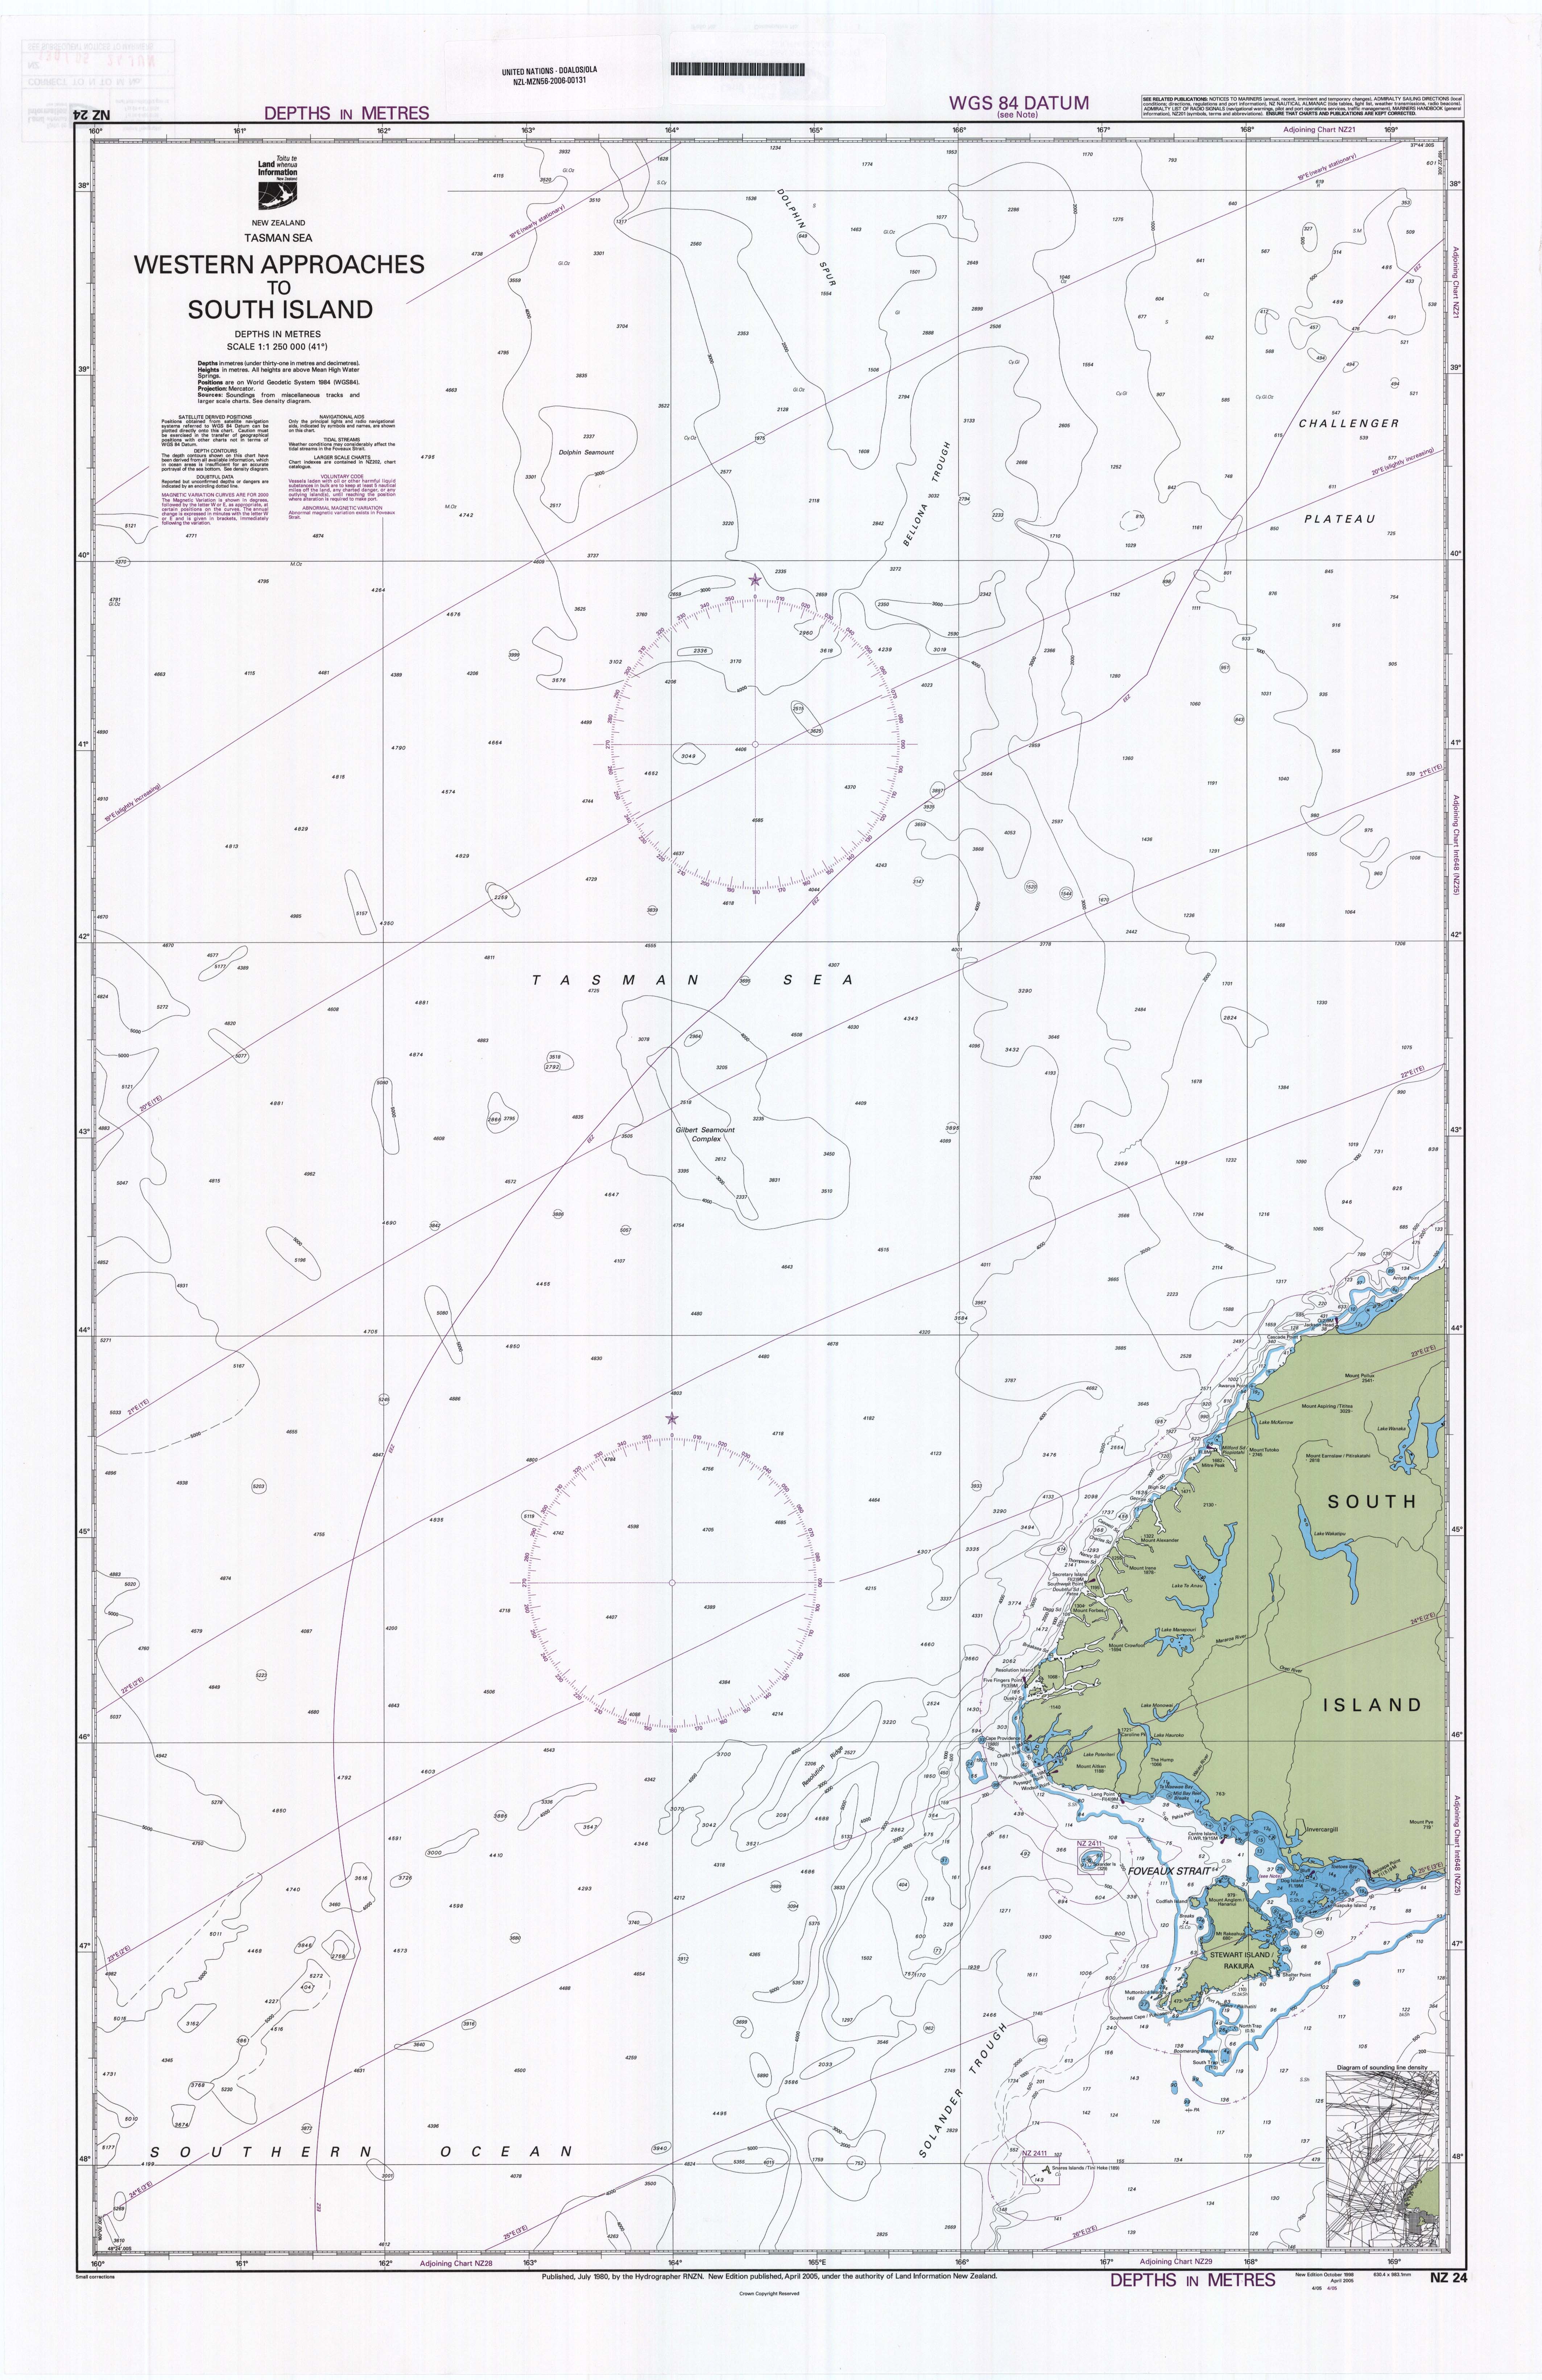
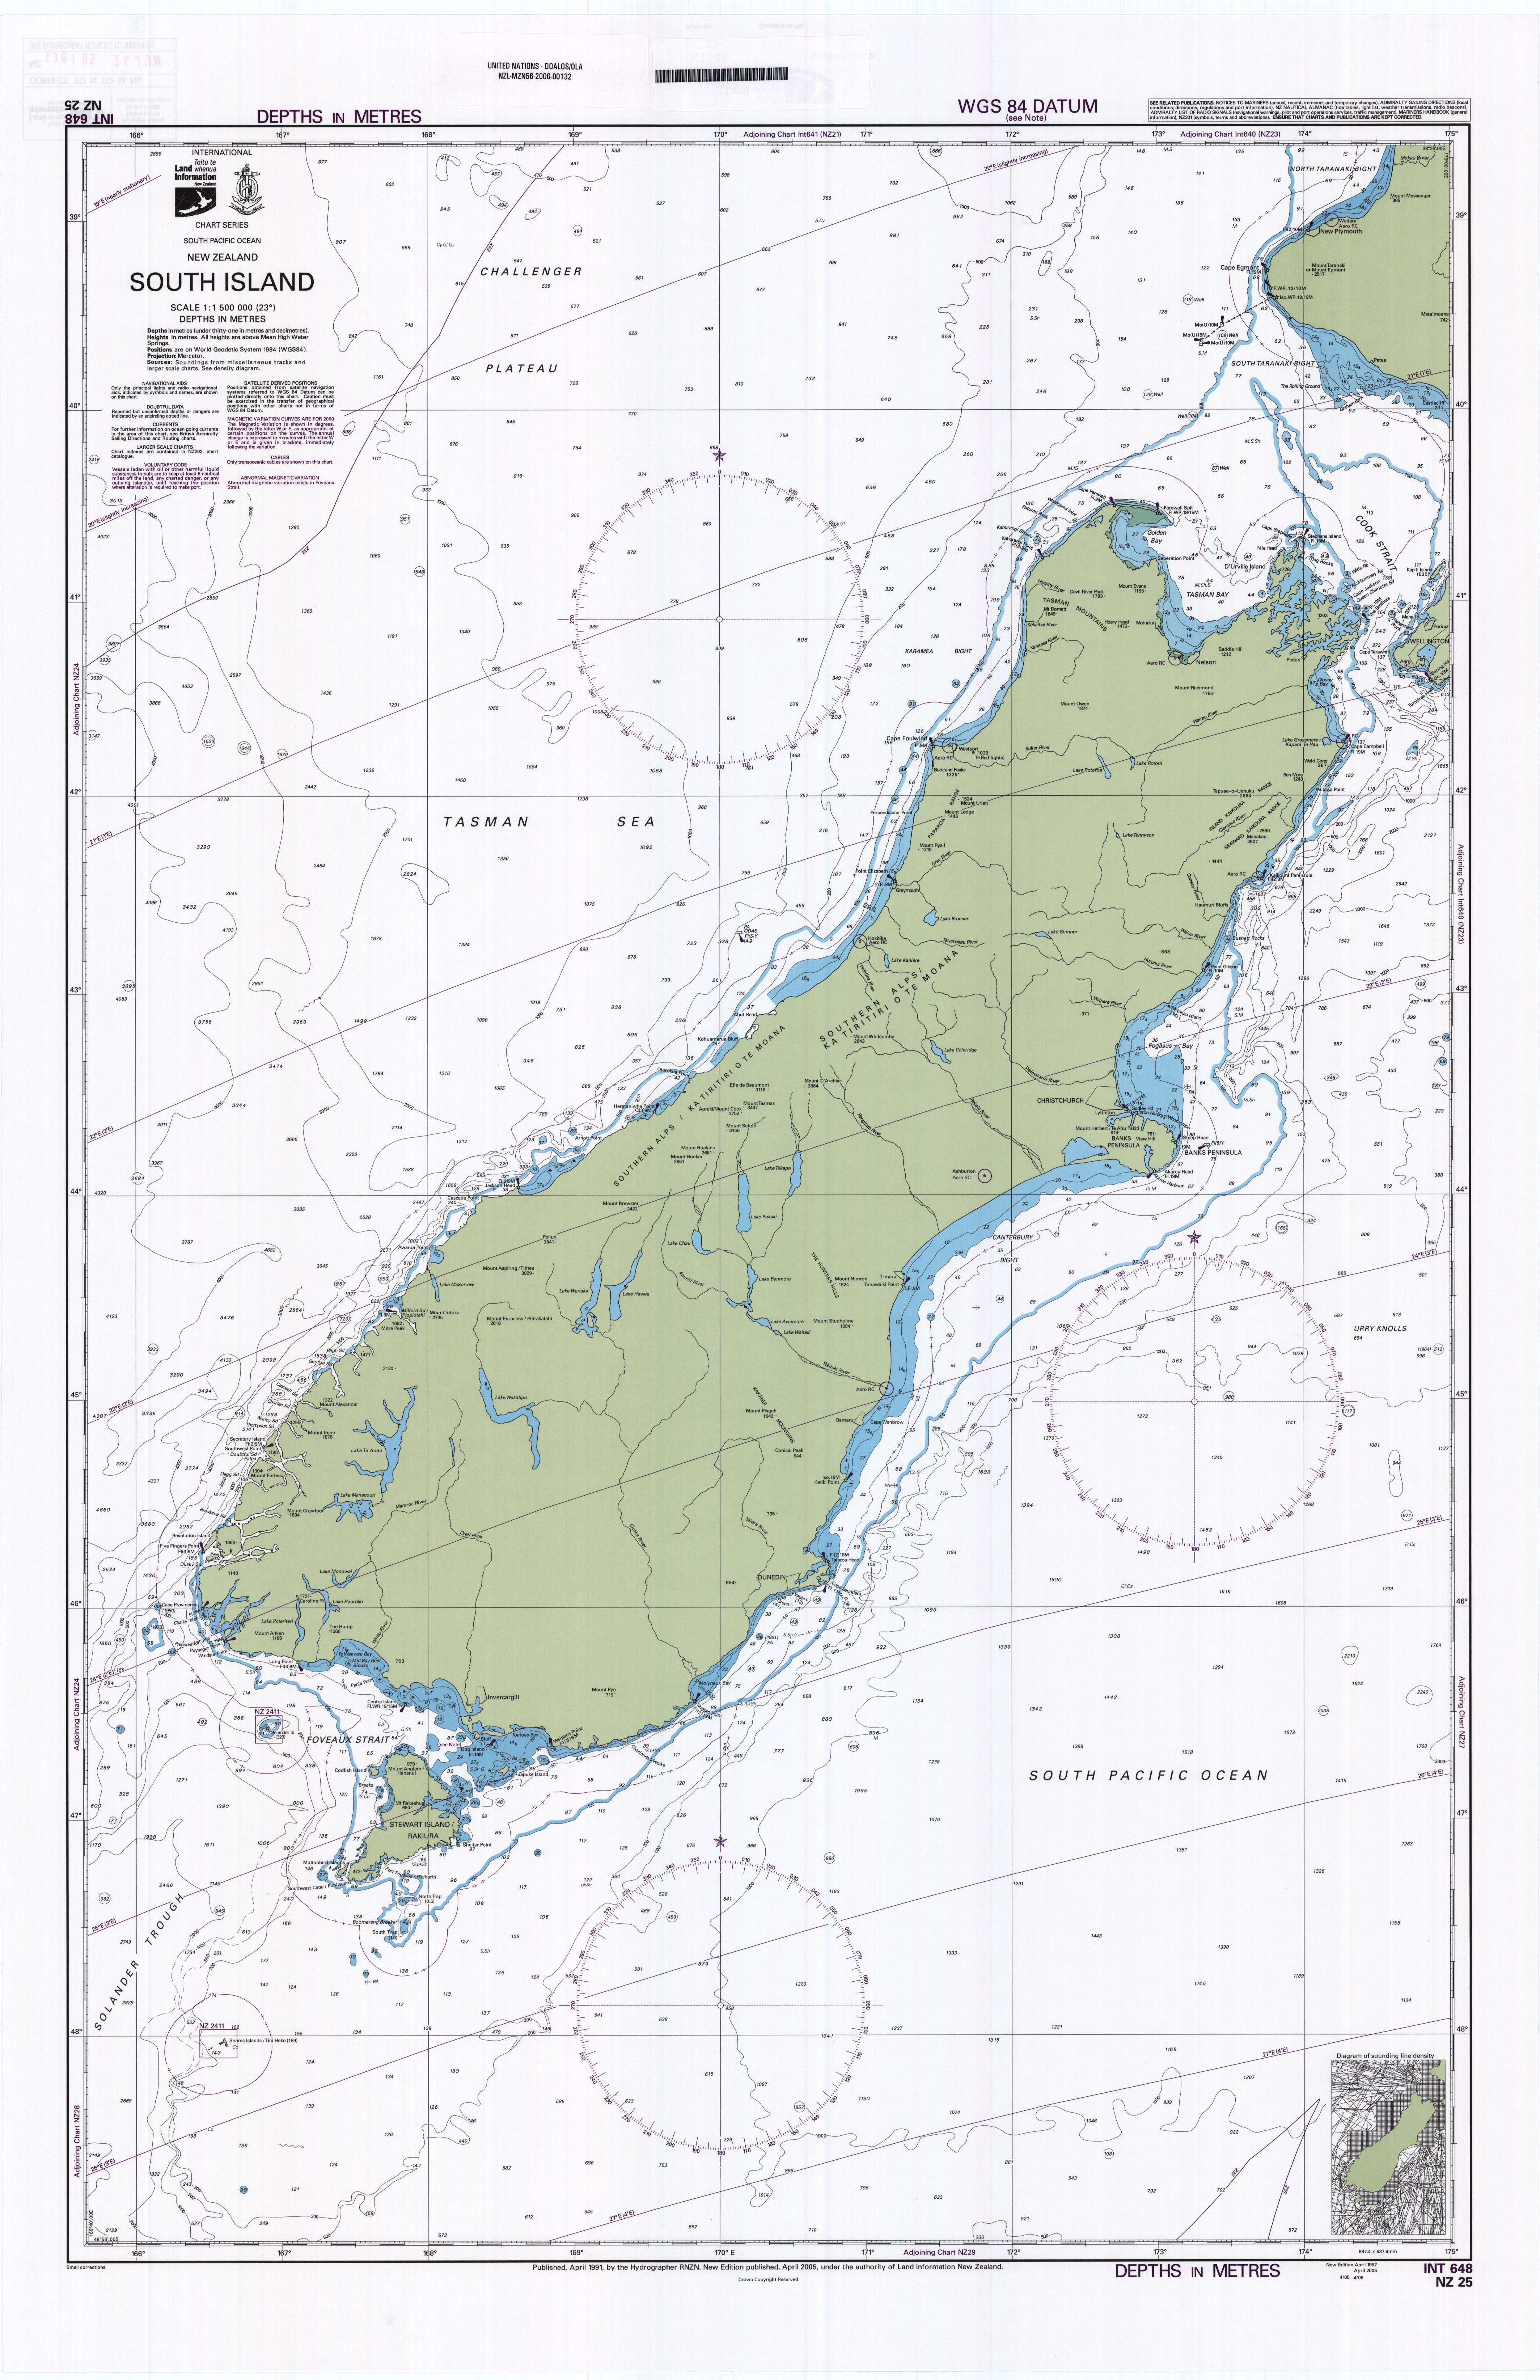
ten nautical charts showing the baselines from which the breadth of the territorial sea is measured, together with the outer limits of its territorial sea and its exclusive economic zone calculated in accordance with the provisions of the Convention. The charts also depict the line of the maritime boundary delimited between New Zealand and Australia by the Treaty between the Government of New Zealand and the Government of Australia Establishing Certain Exclusive Economic Zone and Continental Shelf Boundaries, signed in Adelaide on 25 July 2004.
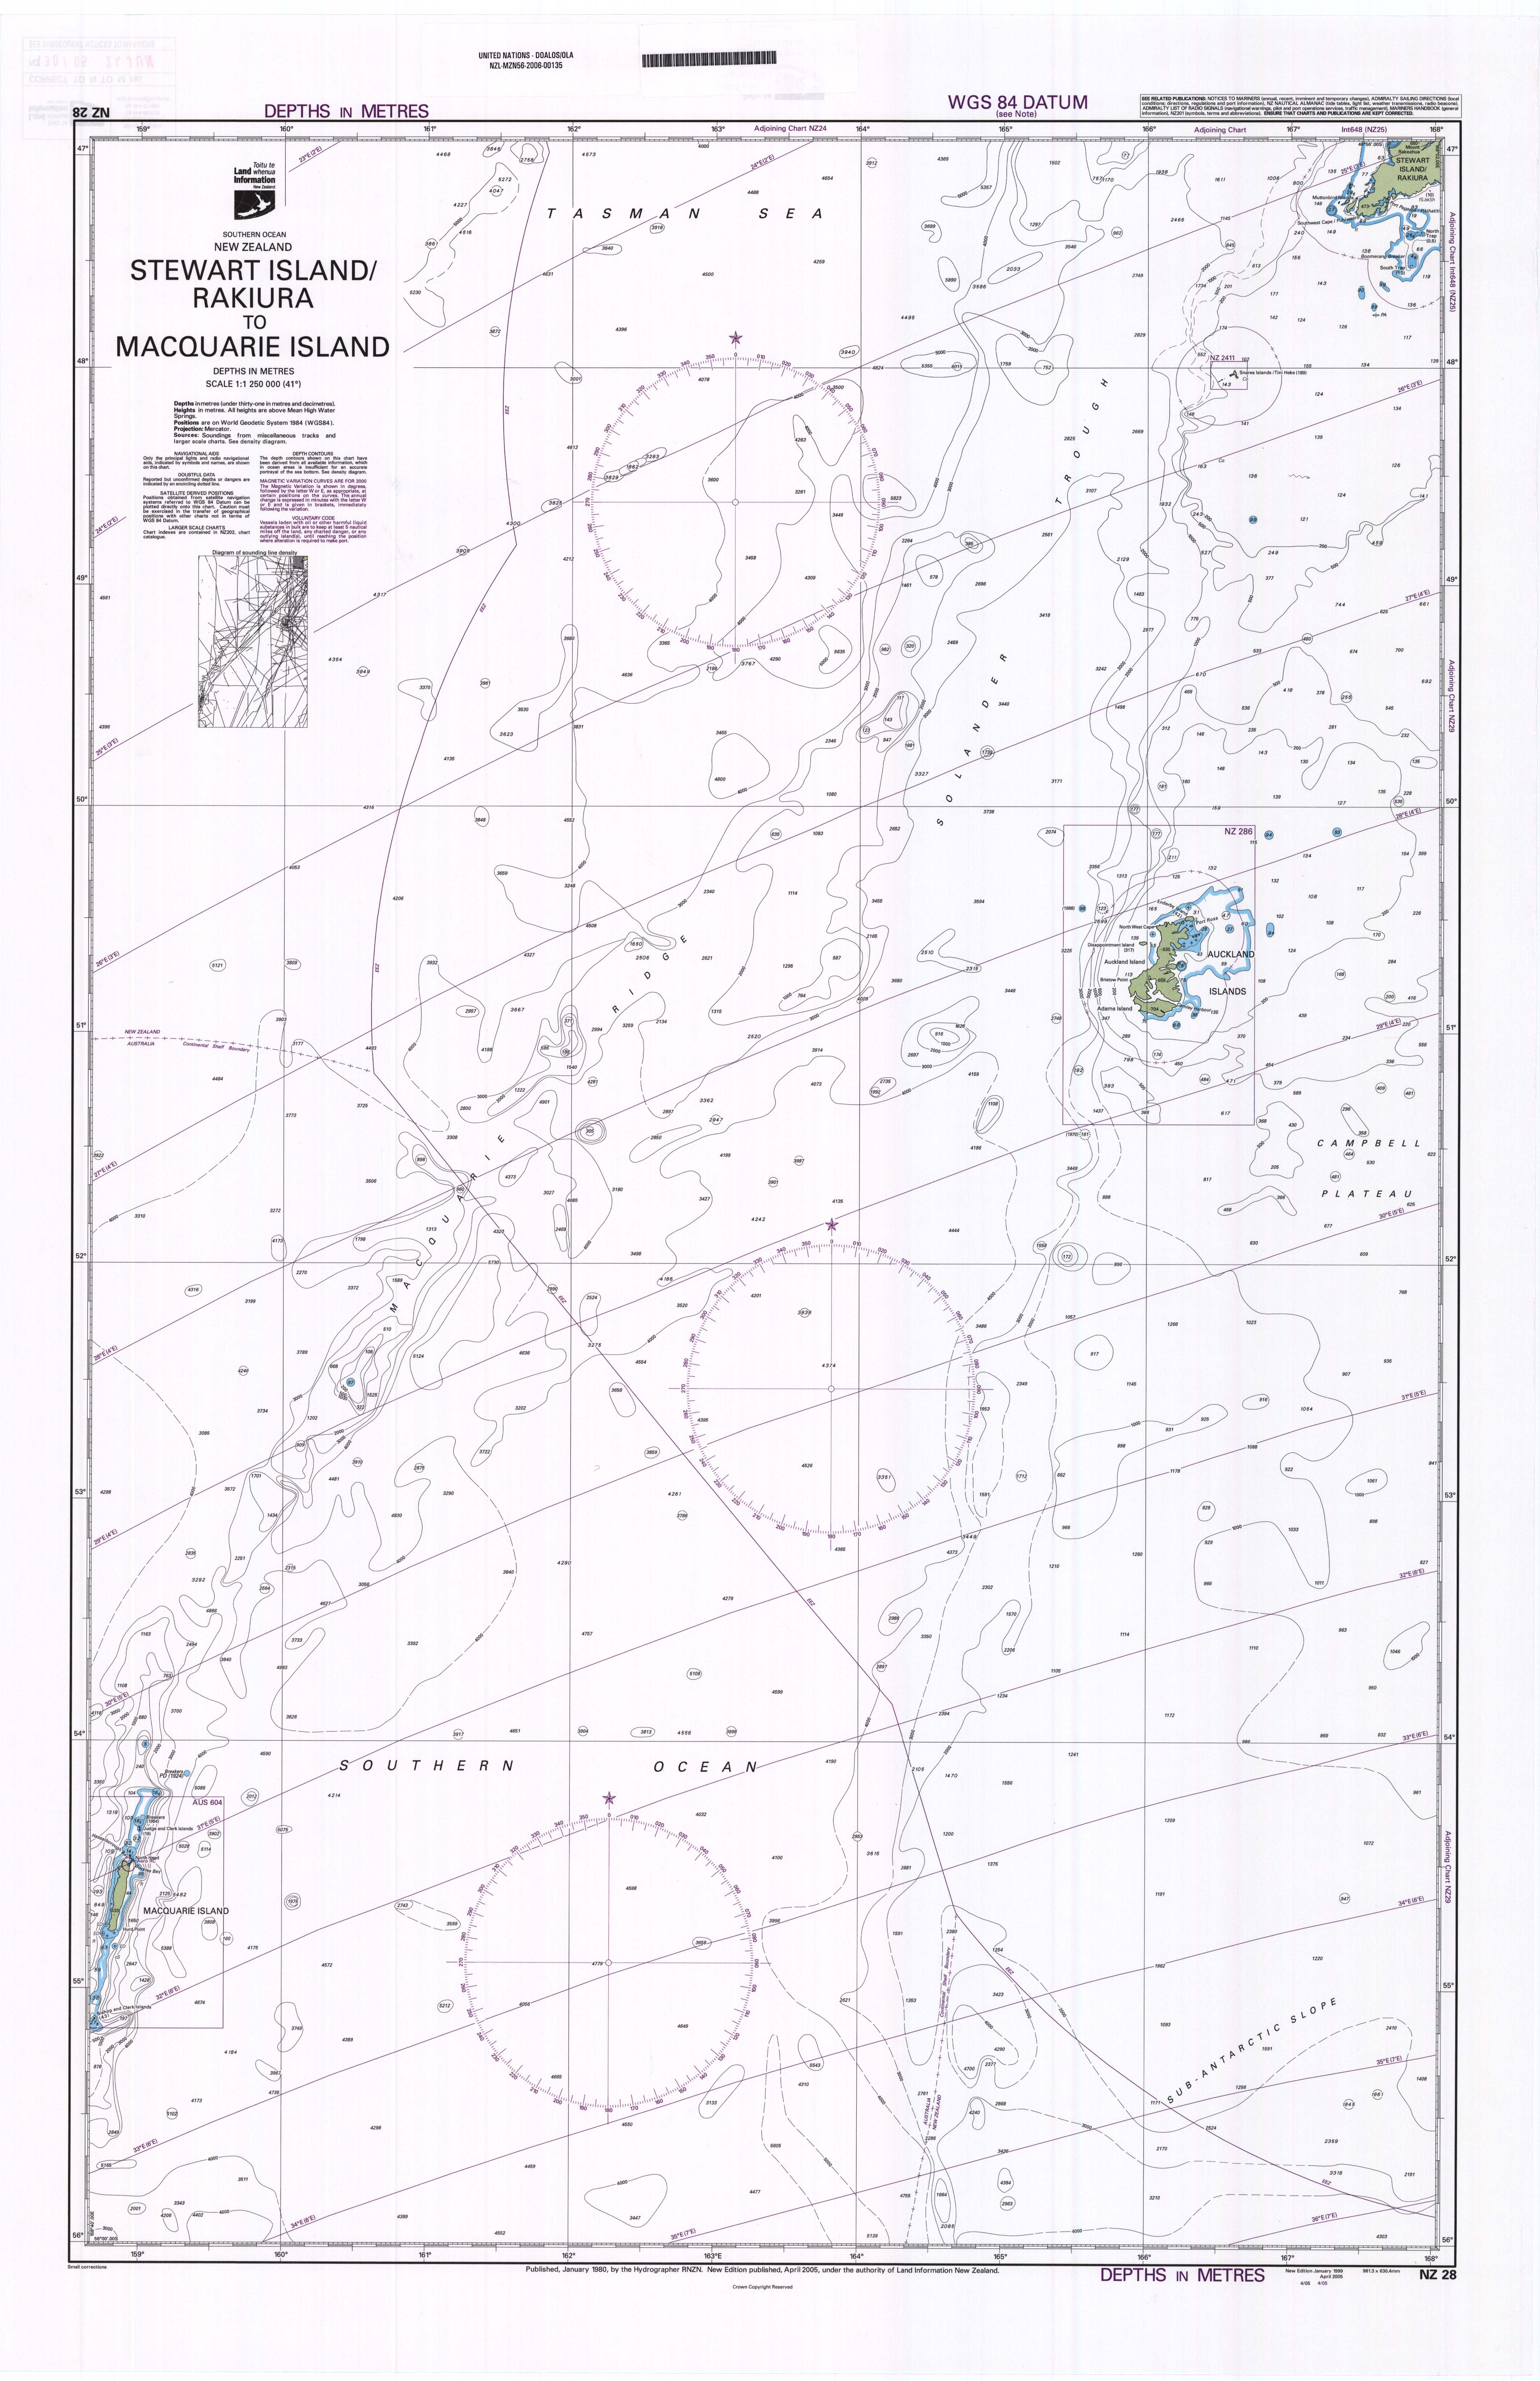
“Norfolk Island to Cape Egmont”, Scale 1:1,500,000“Kermadec Islands to East Cape”, Scale 1:1,500,000“North Island”, Scale 1:1,500,000“Western Approaches to South Island”, Scale 1:1,250,000“South Island”, Scale 1:1,500,000“East Cape to Cook Strait including Chatham Islands”, Scale 1:1,250,000“Chatham Islands to Bounty Islands”, Scale 1:1,250,000“Stewart Island/Rakiura to Macquarie Island”, Scale 1:1,250,000“Stewart Island/Rakiura to Campbell Island/Motu Ihupuku”, Scale 1:1,250,000“Bounty and Antipodes Islands and part of the Southern Ocean”, Scale 1:1,250,000